
Published by Craig Hoebing, Managing Member. Data as of . Capital Market Funds, LLC - CBK-2007014 - Commercial Mortgage Banker. NMLS 1445066. Capital Market Funds arranges loans and is not the lender.
Key findings
- Long-term rates are much higher than a year ago, and short-term rates are lower. The 10-year Treasury was 5.09% on Oct 16, 2026, up from 3.99% on Oct 16, 2025 (+110 bp). Over the same period SOFR fell from 4.30% to 3.88% and bank prime fell from 7.25% to 7.00%. (FRED DGS10, FRED SOFR (NY Fed), FRED DPRIME (Fed H.15))
Fixed-rate permanent loans, which are priced off 5- and 10-year Treasuries, cost more. Floating-rate bridge and bank loans, which are priced off SOFR or prime, cost a little less. The 5-year Treasury was 4.89% on Oct 16 (FRED DGS5).
- Cap rates on Arizona apartments are now at or barely above the 10-year Treasury.
- Phoenix multifamily averaged a 5.17% cap rate in Q2 2026 (Matthews). That is about 8 bp over the 10-year.
- Tucson multifamily averaged about 5.5% (Northmarq Q2 2026), about 41 bp over the 10-year.
- Phoenix Class A traded near 5.0% in Q1, below today's 10-year. Class C traded at 6.5% to 7.0% (Northmarq).
On stabilized Class A deals, fixed-rate debt can cost more than the property yields (negative leverage). Lenders then size loans by DSCR or debt yield rather than LTV.
- CMBS distress hit a five-year high. Trepp's U.S. CMBS delinquency rate rose to 8.02% in September 2026, the highest since November 2020. By property type, office was 12.16%, multifamily 8.04% (up from 6.59% a year earlier), retail 6.58%, lodging 6.18% and industrial 1.14% (Trepp, Sept 2026). These figures are national. Trepp does not publish an Arizona-only rate.
- 2026 is a heavy maturity year. $875 billion, or 17% of the $5.0 trillion in outstanding U.S. commercial mortgages, is scheduled to mature in 2026, and another $652 billion in 2027 (MBA, Feb 9, 2026).
- By property type, 30% of hotel loans, 23% of industrial loans and 13% of multifamily loans come due.
- By lender type, 21% of depository balances, 25% of CMBS/CLO balances and 29% of credit-company and other balances come due.
- Lending volume is recovering. MBA's Q2 2026 originations index was up 16% year over year and up 12% from Q1 (MBA Q2 2026).
- By lender type, CMBS originations rose 68% and depositories rose 61% year over year. GSE volume fell 17% and life company volume fell 27%.
- By property type, retail rose 61%, office 47%, hotel 19%, multifamily 8% and industrial 6%.
1. Benchmark rates
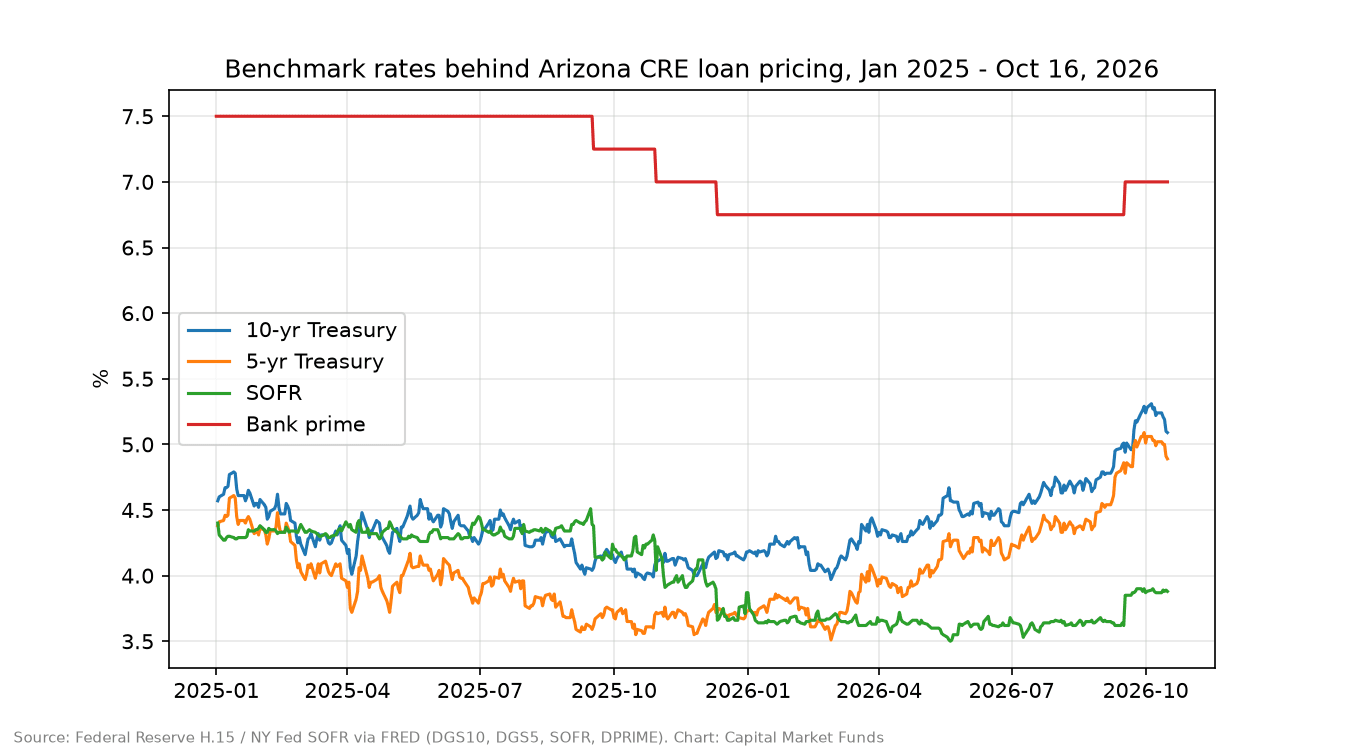
| Index | Oct 16, 2025 | Oct 16, 2026 | Change | Source |
|---|---|---|---|---|
| 10-yr Treasury | 3.99% | 5.09% | +110 bp | FRED DGS10 |
| 5-yr Treasury | 3.55% | 4.89% | +134 bp | FRED DGS5 |
| SOFR | 4.30% | 3.88% | -42 bp | FRED SOFR (NY Fed) |
| Bank prime | 7.25% | 7.00% | -25 bp | FRED DPRIME (Fed H.15) |
The Oct 16, 2025 value for prime is the last observation on or before that date.
2. Arizona cap rates vs. Treasuries
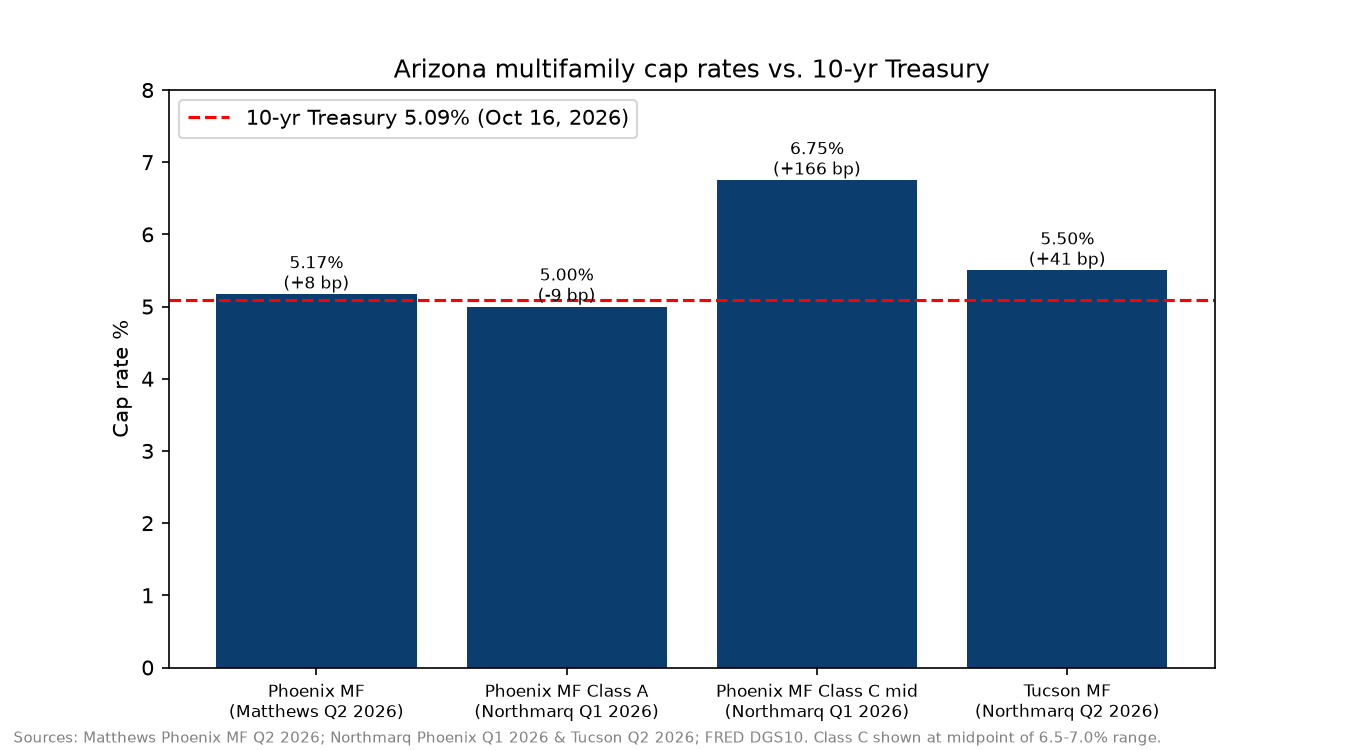
| Market / segment | Cap rate | Spread to 10-yr (5.09%) | Source |
|---|---|---|---|
| Phoenix multifamily, avg, Q2 2026 | 5.17% | +8 bp | Matthews |
| Phoenix MF Class A, Q1 2026 | ~5.0% | ~-9 bp | Northmarq |
| Phoenix MF Class C, Q1 2026 | 6.5-7.0% | +141 to +191 bp | Northmarq |
| Tucson multifamily, H1 2026 | ~5.5% | ~+41 bp | Northmarq Tucson Q2 |
Phoenix industrial cap rates by subtype were cited secondhand: bulk 5.50-6.25%, last-mile 5.25-6.00%, flex 6.50-7.50%, all "widening" (Real Estate Superhumans, citing Q2 2026 benchmarks). Not used in charts. These need to be confirmed against CBRE's H1 2026 Cap Rate Survey before publishing, and the Phoenix table in that survey could not be read for this report.
Not available from free public sources:
- Tucson cap rates for industrial, retail and office
- Arizona-specific spreads over Treasuries
- JLL, Newmark and Cushman Arizona debt figures
FDIC call-report totals for CRE lending by Arizona banks were not looked up for this report. That would be the next addition, using FDIC BankFind. A fifth chart of those balances was not built because there is no free series in this report yet.
3. Distress: CMBS delinquency
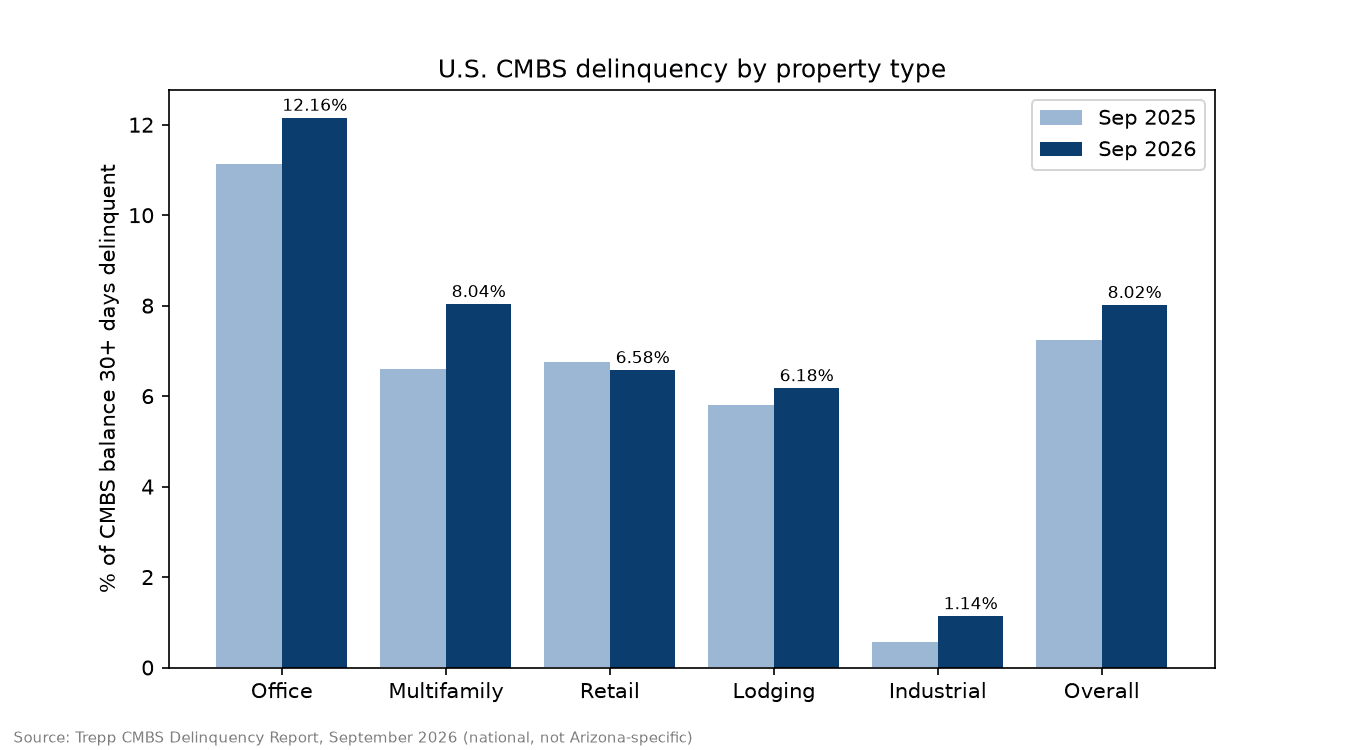
| Figure | Value | Note | Source |
|---|---|---|---|
| U.S. CMBS delinquency rate, September 2026 | 8.02% | Highest since November 2020 | Trepp, Sept 2026 |
| Office | 12.16% | September 2026 | Trepp, Sept 2026 |
| Multifamily | 8.04% | Up from 6.59% a year earlier | Trepp, Sept 2026 |
| Retail | 6.58% | September 2026 | Trepp, Sept 2026 |
| Lodging | 6.18% | September 2026 | Trepp, Sept 2026 |
| Industrial | 1.14% | September 2026 | Trepp, Sept 2026 |
| Rate if performing matured balloons are included | 9.66% | Loans past maturity but still paying | Trepp PDF |
| Seriously delinquent rate | 7.87% | September 2026 | Trepp PDF |
These figures are national. Trepp does not publish an Arizona-only rate.
4. Maturities
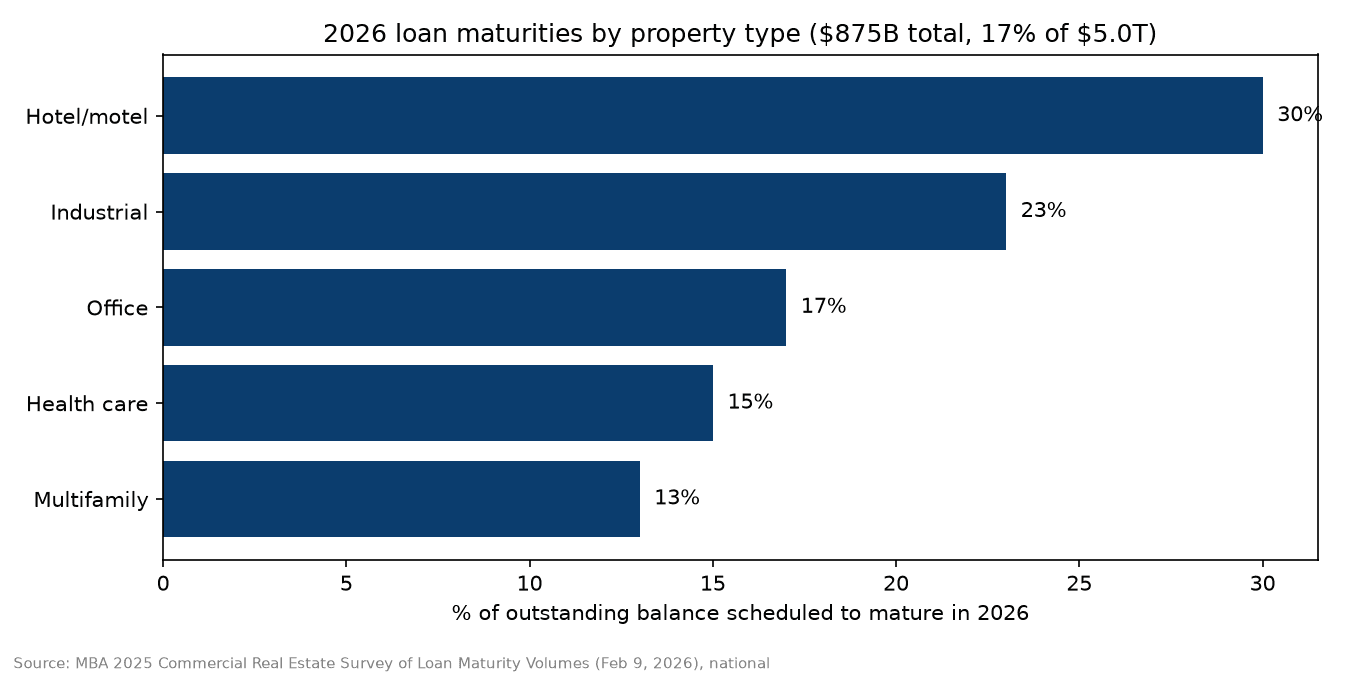
| Figure | Value | Source |
|---|---|---|
| Scheduled to mature in 2026 | $875 billion | MBA, Feb 9, 2026 |
| Share of the $5.0 trillion outstanding | 17% | MBA, Feb 9, 2026 |
| Outstanding U.S. commercial mortgages | $5.0 trillion | MBA, Feb 9, 2026 |
| Scheduled to mature in 2027 | $652 billion | MBA, Feb 9, 2026 |
| Hotel loans | 30% | MBA, Feb 9, 2026 |
| Industrial loans | 23% | MBA, Feb 9, 2026 |
| Multifamily loans | 13% | MBA, Feb 9, 2026 |
| Depository balances | 21% | MBA, Feb 9, 2026 |
| CMBS/CLO balances | 25% | MBA, Feb 9, 2026 |
| Credit-company and other balances | 29% | MBA, Feb 9, 2026 |
The MBA figures are national. MBA does not publish metro-level maturities for free. The longer note already on this site is Arizona commercial loans coming due in 2026.
Lending volume
| Figure | Value | Source |
|---|---|---|
| Q2 2026 originations index versus a year earlier | up 16% | MBA Q2 2026 |
| Q2 2026 originations index versus Q1 | up 12% | MBA Q2 2026 |
| CMBS originations, year over year | rose 68% | MBA Q2 2026 |
| Depositories, year over year | rose 61% | MBA Q2 2026 |
| GSE volume, year over year | fell 17% | MBA Q2 2026 |
| Life company volume, year over year | fell 27% | MBA Q2 2026 |
| Retail | rose 61% | MBA Q2 2026 |
| Office | rose 47% | MBA Q2 2026 |
| Hotel | rose 19% | MBA Q2 2026 |
| Multifamily | rose 8% | MBA Q2 2026 |
| Industrial | rose 6% | MBA Q2 2026 |
The survey is national. It is not Capital Market Funds volume and not an Arizona forecast. The qualitative reading already on this site is the MBA Q2 2026 originations note.
5. What we're seeing on Arizona deals
These are Capital Market Funds observations. They are individual transactions, not a market average or a rate quote. Terms depend on the property, the sponsor and the market at the time. Capital Market Funds arranged the loans. It is not the lender.
- Tucson value-add multifamily: we arranged a life company loan at 5.75%, interest-only, for up to 80% of total project cost.
- Peoria six-bay auto service center: we arranged a credit union loan at 6.25% and 65% LTV.
- Timing: our typical close is 70 to 90 days from application.
6. Takeaways for Arizona owners
- Run any 2026 or 2027 maturity against today's 5-year and 10-year Treasuries, not the rate on the existing loan.
- Debt service coverage, not LTV, is setting loan size on lower-cap-rate assets.
- Compare all the capital sources: banks, credit unions, life companies, CMBS and debt funds. In Q2 their volumes moved in opposite directions.
Methodology
- Rates are daily FRED observations as of Oct 16, 2026.
- Market data comes from the most recent free public reports, with each one cited where it is used.
- Every figure is national unless it is labeled Arizona, Phoenix or Tucson.
- The four charts are the ones prepared for this report. Phoenix industrial cap rates cited secondhand are not in the charts.
Capital Market Funds, LLC - CBK-2007014 - Commercial Mortgage Banker. NMLS 1445066. Craig Hoebing · Capital Market Funds · (480) 495-8072 · craig@capmarkfund.com · 7373 E Doubletree Ranch Rd #255, Scottsdale, AZ 85258 · https://capmarkfund.com